Introduction
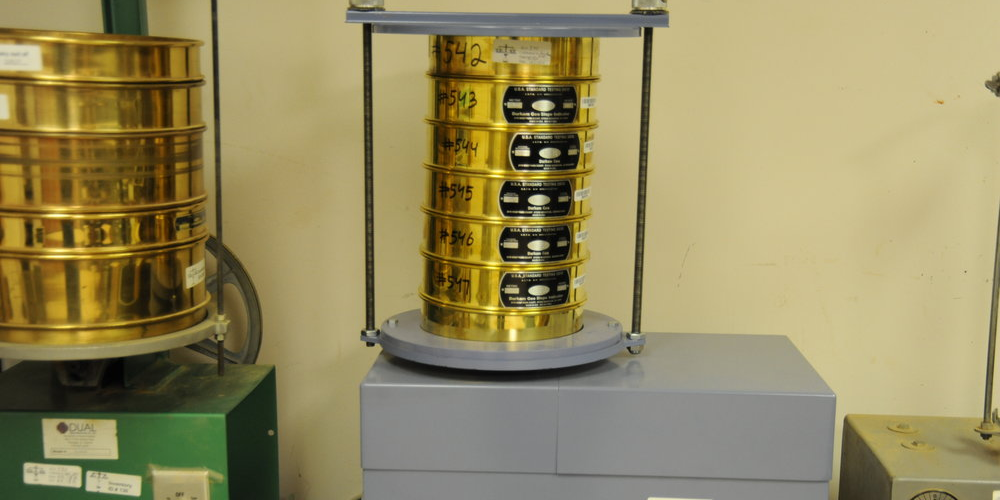
A sieve analysis or graduation test is a practice used in civil engineering to assess the particle size distribution of a granular material (Wikipedia, 2017). The size distribution is often of critical importance to the way the material performs in use. A sieve analysis can be performed on any type of non-organic and organic granular material including sands, crushed rock, clays, granite, feldspar, coal, even dried crushed asphalt. A typical sieve analysis involves a nested column of sieves with wire mesh cloth (screen) as shown below.
There are two methods of sieve analysis depending on the material to be measured. They are:
- Dry Analysis
- Wet analysis
Wet sieve analysis gives a more reproducible result. It is used when dry sieving cannot produce an acceptable degree of separation between the individual fractions. It simply involves the removal of fine particles (particles less than 75micrometer in diameter) that may be difficult to sieve, prior to drying and testing a sample normally (www.globalgilson.com, 2017). For dry sieving, water is not added. The wet sieving procedure applies to solids with the following properties:
- Practically insoluble in water
- Not affected by water; for example: solids that expand when wet would not work
- Remain unchanged by heat up to 110oC
Objective(s) of the Experiment
This practical is carried out to assess the particle size distribution of a soil sample.
Equipments and Materials Needed
- A scale sensitive to 0.01 g
- Soil Sample
- Enough Water
- Sieves, bottom pan, and a lid
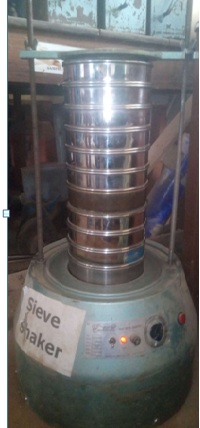
- Mechanical sieve shaker
- Oven capable of maintaining a uniform temperature of 105oC – 115oC
Procedures
- Clean each sieve to remove any soil left over from previous tests. Use the soft brush on the finer mesh sieve and the wire brush on the coarser mesh sieve. Take care not to damage the mesh.
- Weigh and record the mass of each sieve, including the bottom pan.
- Obtain the appropriate amount of sample.
- Weigh and record the mass of the sample selected (W).
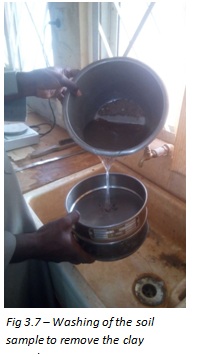
- Obtain the 425mm and 75mm sieve, with the 425mm sieve on top, wash the sample continuously with water and pour the mixture on the sieves arrangement.
- When the water coming out of the sieves becomes clean, it implies that the sand is free of clay (particles less than 0.075mm).
- The soil retained on the sieves is poured together into a container and the container is placed in an oven for 24hours at a temperature of 105oC – 115oC to get rid of the water contained. The dried soil sample is then used for the analysis.
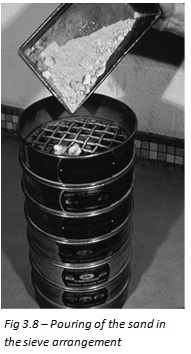
- Assemble the sieves in order from largest to smallest so that the coarsest is at the top and the finest is on the bottom followed by the pan (as shown in the figure above).
- Place the sample on to the top sieve taking care not to lose any of the mass and place the lid securely on top.
- Place the set of sieves in the sieve shaker and adjust the clamps to secure the sieves.
- Set the shaker on high and set the timer to 5-10 minutes (or manually shake the arrangement vigorously for several minutes if sieve shaker in not available.)
- Remove the sieves from the sieve shaker
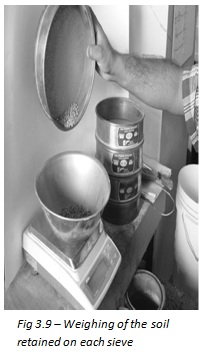
- Weigh and record the mass retained in each sieve.
NOTE: For Dry Sieving, the procedure is started from number 8.
Results and Calculations
- Determine the weight of soil that is retained on each sieve (Ri) and find the total (W).
- Calculate the cummulative weight of soil that is retained on each sieve (ΣRi):
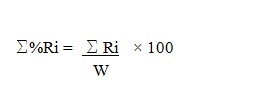
- Calculate the cummulative percentage of soil that is retained on each sieve (%ΣRi):
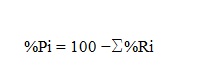
- Calculate the percent passing each sieve (%Pi):
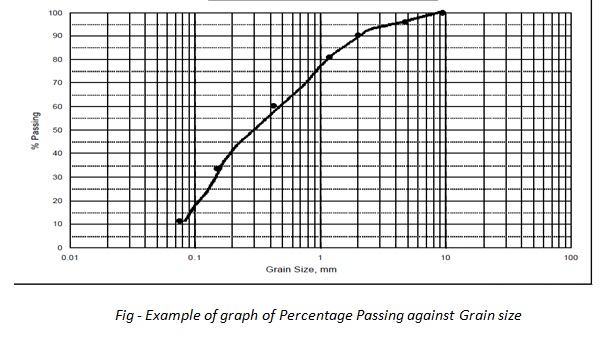
- Plot a graph of Percentage Passing against Grain Size on a semi-logarithmic chart
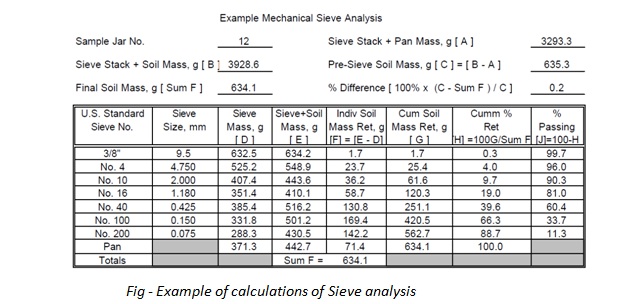
An example is shown below and the respective distribution plotted:
Discussion and Conclusion
The particle size distribution curve is a very important quality of sand which can be used to determine the following parameters:
- Effective size (D10):
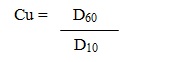
This is the diameter of the size of particle (grain size) corresponding to 10% passing. - Uniformity Coefficient Cu:
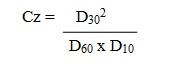
- Coefficient of Gradation Cz:
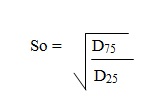
- Sorting Coefficient So:
Also, from the particle size distribution curve, three Types of Grading can be observed:
- Well Graded Soil: The size of soil is distributed over a wide range
- Gap Graded Soil:Having two or more uniformly graded fraction
- Poorly Graded:Most of the soil grains have the same size
References
- Kandhal, P.S. and Cooley, L.A. (2001).NCHRP Report 464: The Restricted Zone in the Superpave Aggregate Gradation Specification. Transportation Research Board, National Research Council. Washington, D.C.
- Das, B. M. (2006). Principles of Geotechnical Engineering, 7th ed. Cengage Learning, Stamford.
- www.wikipedia.com
- Mamlouk, M.S. And Zaniewski J.P. (2011). “Materials For Civil and Construction Engineers”
")


