Introduction
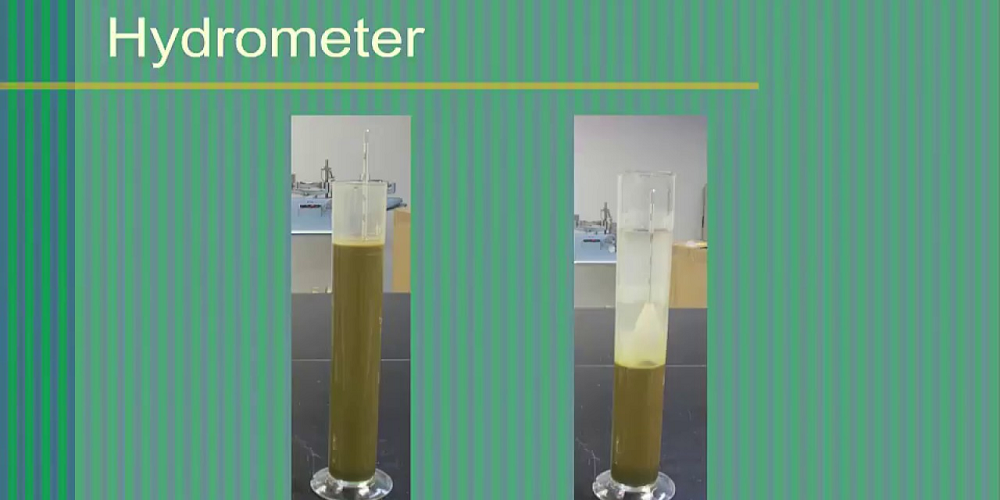
Hydrometer analysis is based on the principle of sedimentation of soil grains in water. When a soil specimen is dispersed in water, the particles settle at different velocities, depending on their shape, size, weight, and the viscosity of the water.
Hydrometer analysis is a widely used method of obtaining an estimate of the distribution of soil particle sizes from the No. 200 (0.075 mm) sieve to around 0.01 mm. The data are presented on a semi-logarithmic plot of percent finer vs. particle diameters and may be combined with the data from a sieve analysis of the material retained on the No.200 sieve. The principal value of the hydrometer analysis appears to be to obtain the clay fraction (generally accepted as the percent finer than 0.002 mm). The hydrometer analysis may also have value in identifying particle sizes < 0.02 mm in frost susceptibility checks for pavement subgrades. This test is done when more than 20% pass through No.200 sieve and 90% or more passes the No. 4 (4.75 mm) sieve.
The hydrometer analysis is based on Stokes’ Law, which gives the relationship among the velocity of fall of spheres in a fluid, the diameter of the sphere, the specific weights of the sphere and of the fluid, and the fluid viscosity. In equation form this relationship is

Where:
- v = velocity of fall of the spheres (cm/s)
- Gs = specific gravity of the sphere
- Gf = specific gravity of fluid (varies with temperature)
- h = absolute, or dynamic, viscosity of the fluid (g /(cm * s))
- D = diameter of the sphere (cm)
Solving the equation for D and using the specific gravity of water Gw, we obtain :

But v = Distance/ Time = L / t

Where 0.002 mm < D < 0.2 mm
Note that the value of A is a function of Gs and h, which are dependent on the temperature of the test. Table 1 gives the variation of A with the test temperature and the specific gravity of soil solids.

Objective(s) of the Experiment
This test is carried out to estimate the distribution of soil particle sizes by hydrometer analysis
Equipments and Materials Needed
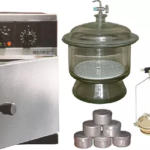
The equipments and materials needed for hydrometer analysis are:
- Hydrometer
- Quantity (about 2.5L per test) of distilled water
- Sedimentation cylinder (1000mL cylinder) also termed a hydrometer jar
- Graduated 1000mL cylinder for control jar
- Soil-dispersion device (malt mixer or air-jet dispersion)
- Dispersion agent (NaPO3 or Na2SiO3)
- Hydrometer jar bath (optional, for temperature control)
- Thermometer


Procedures
- Prepare the control jar by adding 125 ml of 4% sodium metaphosphate (NaPO3) solution and sufficient distilled water to produce 1000 ml. (This solution can be made by mixing 40g of dry chemical with enough water to make 1000 ml). Put the hydrometer into the control cylinder and record zero and meniscus correction; then record the temperature by putting the thermometer in it
- Weigh out exactly 50g of soil passing the No. 200 sieve. Mix the soil with 125 ml of 4% sodium metaphosphate (NaPO3) solution. Allow the soil mixture to stand about 12 hours.
- At the end of the soaking period, transfer the mixture to a dispersion (or malt mixer) cup and add tap water until the cup is about two-thirds full. Mix for 1 minute. After mixing, carefully transfer all the contents of the dispersion cup to the sedimentation cylinder. Rinse any soil in the dispersion cup by using a plastic squeeze bottle or adding stabilized water and pour this into the sedimentation cylinder. Now add distilled water to fill the cylinder to the 1000 ml mark.
- Cap the sedimentation cylinder with a No. 12 rubber stopper and carefully agitate for about 1 min. Agitation is defined as turning the cylinder upside down and back 60 turns for a period of 1 min. An upside down and back movement is 2 turns.
- Put the sedimentation cylinder beside the control cylinder and start the stopwatch immediately. This is cumulative time t = 0. Insert the hydrometer into the sedimentation cylinder.
- Take hydrometer readings at cumulative times t = 0.25 min., 0.5min., 1 min. and 2 min. Always read the upper level of meniscus. Remove and place the hydrometer in the control jar.
- Continue taking hydrometer and temperature readings at approximate elapsed times of 8, 15, 30 and 60 min. and then 2, 4, 8, 24 and 48 hr. For each reading, insert the hydrometer into the sedimentation cylinder about 30 sec before reading is due. After the reading is taken, remove the hydrometer and put it back into the control cylinder.
Results and Calculations
- Calculate corrected hydrometer reading for percent finer, RCP = R + Ft + Fz
- Calculate percent finer = (A * RCP * 100) / Ws
Where,
Ws = dry weight of soil used for hydrometer analysis
A = correction for specific gravity (as hydrometer is calibrated for Gs = 2.65)
Therefore,
A = 1.65 x Gs / {(Gs – 1) x 2.65} - Calculate corrected hydrometer reading for determination of effective length, RCL = R + Fm
- Determine L (effective length) corresponding to RCL given in Table 2.
- Determine A from Table 1
- Determine D

Corrections to hydrometer readings
- Zero Correction (Fz): If the zero reading in the hydrometer (in the control cylinder) is below the water meniscus, it is (+), if above it is (–), if at the meniscus it is zero.
- Meniscus Correction (Fm): Difference between upper level of meniscus and water level of control cylinder.
- Temperature correction (Ft): The temperature of the test should be 20oC but the actual temperature may vary. The temperature correction is approximated as Ft = -4.85 + 0.25 T (for T between 15oC to 28oC)
Reports
The Data Sheet below is used for the presentation of the report.

Plotting
The hydrometer readings are recorded at regular intervals as indicated in the data sheet. From the data obtained the particle size distribution curve is plotted in the semi-logarithmic graph sheet. In many instances, the results of sieve analysis and hydrometer analysis for finer fractions for a given soil are combined on one graph, such as the one shown in Figure 1.

References
- Mylonakis, G. “Lab Experiment #3b: Hydrometer Analysis”. The City College of New York Department of Civil Engineering.
- Indian Institute of Technology Gandhinagar. “Wet Sieving and Hydrometer Analysis IS: 2720 (Part 4) – 1985 (Reaffirmed-2006)”. Department of Civil Engineering Soil Mechanics Laboratory.
- Das, B.M.and Sobhan, K. (2014). “Principles of Geotechnical Engineering Eighth Edition, SI”
